Groupon 案例
Groupon 是一家致力於利用社交媒體協調團購的電子商務公司。為了取得購物折扣,Groupon團購會要求達到某種條件的最低要求,買家才能享有折扣,例如,最低購買人數。這類的最低購買條件是否會影響交易結果呢?Propensity score matching (PSM) 可以幫助我們用統計的方法回答此類的問題。以下我們定義一個二元自變數(Independent Varaible, IV)
- 對照組: 無最低購買人數要求的優惠券(0)
- 處理組: 有最低購買人數要求的優惠券(1)
範例資料 groupon.csv 有下示結構,其中包含三個依變數:收入 、售出數量和臉書讚數:
# <class 'pandas.core.frame.DataFrame'>
# RangeIndex: 710 entries, 0 to 709
# Data columns (total 13 columns):
#  #   Column           Non-Null Count  Dtype
# ---  ------           --------------  -----
#  0   deal_id          710 non-null    object
#  1   start_date       710 non-null    object
#  2   min_req          710 non-null    int64
#  3   treatment        710 non-null    int64
#  4   prom_length      710 non-null    int64
#  5   price            710 non-null    int64
#  6   discount_pct     710 non-null    int64
#  7   coupon_duration  710 non-null    int64
#  8   featured         710 non-null    int64
#  9   limited_supply   710 non-null    int64
#  10  fb_likes         710 non-null    int64
#  11  quantity_sold    710 non-null    int64
#  12  revenue          710 non-null    int64
# dtypes: int64(11), object(2)
# memory usage: 72.2+ KB

df = pd.read_csv('data/groupon.csv')
df.info()


grouped = df.groupby("treatment")
grouped[["fb_likes", "quantity_sold", "revenue"]].mean()
#                 fb_likes	quantity_sold	revenue
#  treatment
#          0	77.941296	333.002024	9720.987854
#          1	113.203704	509.351852	12750.694444
在開始分析前,我們先引入多項工具包,並自定二個函數。
import numpy as np
import pandas as pd
import matplotlib.pyplot as plt
import seaborn as sns
import math
from scipy.stats import ttest_ind
from sklearn.linear_model import LogisticRegression
from sklearn.neighbors import NearestNeighbors


def t_test(df_control, df_treatment, DV="revenue", alpha=0.05):

    ctl_avg = df_control[DV].mean()
    trt_avg = df_treatment[DV].mean()

    # compare samples
    _, p = ttest_ind(df_control[DV], df_treatment[DV])
    print(f"p = {p:.3f}")
    print(f"Control vs. treatment: {ctl_avg:.2f} vs. {trt_avg:.2f}")

    # interpret
    if p > alpha:
        print(
            "H0 is plausible."
        )
    else:
        print("The group means differ")
    return p

def logit(p):
    # The logit function is defined as the logarithm of the odds of the probability p of a certain event occurring:
    # Logit(p) = log(p / (1 - p))
    return math.log(p / (1 - p))
在未使用傾向評分進行配對前,t-test顯示,當優恵卷附加最低購買需求時,似乎和高收益、更多臉書讚、及售出更多商品是相關的。
# student's t-test for revenue (dependent variable)
# separate control and treatment for t-test
df_control = df[df.treatment == 0]
df_treatment = df[df.treatment == 1]

p_revenue = t_test(df_control, df_treatment, DV="revenue")
p_fb = t_test(df_control, df_treatment, DV="fb_likes")
p_qs = t_test(df_control, df_treatment, DV="quantity_sold")

# p = 0.040
# Control vs. treatment: 9720.99 vs. 12750.69
# Different group means (reject H0)
# p = 0.004
# Control vs. treatment: 77.94 vs. 113.20
# Different group means (reject H0)
# p = 0.001
# Control vs. treatment: 333.00 vs. 509.35
# Different group means (reject H0)
多元邏輯回歸模型 (Multiple Logistic Regression)
當我們使用邏輯回歸將多個共變數轉換為機率值,此概率便是傾向評分 (PS),它表示觀察結果屬於處理組的概率(1 = 處理,0 = 對照)。
基本上,這是一個分類問題:根據樣本的特徵,來預測樣本屬於處理組中的概率。在進行邏輯回歸前,我們必須先審慎地選擇適合的變數。以下兩項原則可幫助排除一些不適當的變數:
- 和自變項相關係數接近1的變數
- 和自變項有高相關的變數
在此分析中,我們選擇了六個變數:prom_length、price、discount_pct、coupon_duration、featured 和 limited_supply來訓練邏輯回歸模型。在邏輯回歸模型中,目標變數--屬於處理理或是對照組--是被視為依變數,而不是如同我們的主要研究問題將之視為自變數。
X = df[['prom_length', 'price', '適discount_pct', 'coupon_duration', 'featured','limited_supply']]
y = df['treatment']

lr = LogisticRegression()
lr.fit(X, y)
pred_prob = lr.predict_proba(X)  # probabilities for classes

# the propensity score (ps) is the probability of being 1 (i.e., in the treatment group)
df['ps'] = pred_prob[:, 1]

sns.histplot(data=df, x='ps', hue='treatment')
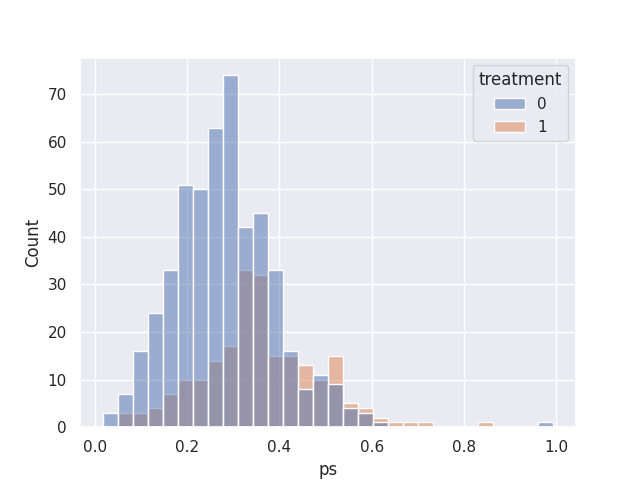
以下直方圖顯示對照組和處理組在傾向評分上的有相當程序的重合,因此我們應該可以找到適當數量的配對。

KNN模型
PSM的演算法類似於處理單一共變數的情況。第一、我們將每一個處理組中的樣本依序取出,第二、在對照組中找出與此處理組樣本在傾向分數上相近的樣本。在此我們必須了解傾向分數是連續的數值資料,所以兩個數字是不可能100%完全相同,因此PSM演算法的第三步是,使用 KNN 的統計模型計算每一樣本之間的相對傾向分數(稱之為距離),第四、據此距離參數找出每一個樣本以及與它鄰近的其他 N ,例如,9個樣本。
- 在開始之前,我們必須先定義一鄰近半徑以來決定誰是鄰居誰不是有鄰居,例如我們可以使用25%的傾向分數標準差做為半徑。
- 當使用一對多匹配 (此例我們使用一對九),我們從前 N 個鄰居中選擇 M 個最接近的匹配項 (此例M=1)。
因為半徑定義未考量所有的傾向分數,所以有些處理組的樣本可能找不到任何鄰近樣本,這些處理組的樣本將不會被使用到。
# Define 25% of standard deviation of the propensity score as the caliper
caliper = np.std(df.ps) * 0.25
print(f"caliper (radius) is: {caliper:.4f}")

# Get the 10 closest neighbors
n_neighbors = 10

# setup knn
knn = NearestNeighbors(n_neighbors=n_neighbors, radius=caliper)

ps = df[["ps"]]
knn.fit(ps)
下面的程式碼檢驗KNN模型所儲存的距離及序號參數,此例中 K=9 ,因此distance[0]的第一個元素是參考點,其距離值被定為0,其他樣本的距離值則是相對於此參考點,distance儲存的其他九個元素則列出距此參考點最近的九個資料點。
# distances and indexes
distances, neighbor_indexes = knn.kneighbors(ps)

# the 10 closest points to the first point
print(distances[0])

# [0.00000000e+00 7.98366770e-05 3.78158885e-04 7.53425375e-04
# 1.18941498e-03 1.37592834e-03 1.37592834e-03 1.62491413e-03
# 1.67879150e-03 2.01192411e-03]

print(neighbor_indexes.shape)
# (710, 10)
# [0 348 388 415 624 494 150 463 372 345]
neighbor_indexes儲存樣本於原來資料檔中的序號。
df.loc[neighbor_indexes[0], ["prom_length", "price", "treatment", "ps"]]

#     prom_length	price	treatment	      ps
#   0	        4	   99	        1	0.259179
# 348	        3	   19	        0	0.259099
# 388	        3	   20	        0	0.258801
# 415	        3	   15	        0	0.258425
# 624	        3	   50	        0	0.260368
# 494	        3	   29	        0	0.260555
# 150	        3	   29	        1	0.260555
# 463	        3	   30	        0	0.257554
# 372	        4	   16	        0	0.260858
# 345	        3	   25	        0	0.257167


matched_control = []  # a container to store the matched sample

# 1. iterate over the dataframe
for current_index, row in df.iterrows():
# 2. When the current row is in the control group,
    if row.treatment == 0:
    # set matched column to nan
        df.loc[current_index, "matched"] = np.nan
    else:
        for idx in neighbor_indexes[
            current_index, :
        ]:  # for each row in treatment, find the k neighbors
            # 3. make sure the current row is not itself
            # 4. and the neighbor is in the control
            if (current_index != idx) and (df.loc[idx].treatment == 0):
            # 5. sampling without replacement - if this control sample
            # has not been matched yet,
                if idx not in matched_control:
                # we record the index of the matching sample and
                    df.loc[current_index, "matched"] = idx
                    # then append it to the matched list
                    matched_control.append(idx)
                    break


df.treatment.value_counts()
# treatment
# 0    494
# 1    216
# Name: count, dtype: int64

# dfmatched.value_counts()
s = df[["matched"]]
nan_count = s.isna().sum()  # or s.isnull().sum() for older pandas versions
nan_count
# matched    526
# dtype: int64
在取出匹配後的處理組及對照組,我們將之重新整理為一個新的資料集。
# control have no match
treatment_matched = df.dropna(subset=["matched"])  # drop not matched

# matched control observation indexes
control_matched_idx = treatment_matched.matched
control_matched_idx = control_matched_idx.astype(int)  # change to int
control_matched = df.loc[control_matched_idx, :]       # select matched control observations

# combine the matched treatment and control
df_matched = pd.concat([treatment_matched, control_matched])

df_matched.treatment.value_counts()
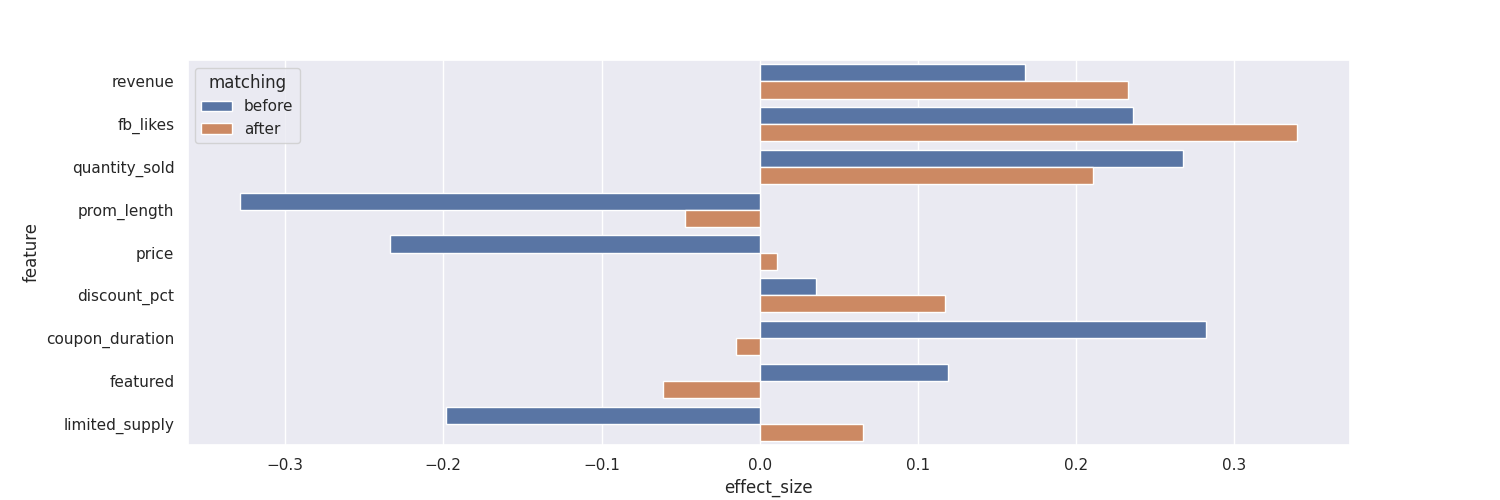
最後,我們使用Cohen's d的效果值來檢驗匹配前後的異同。
from numpy import mean
from numpy import var
from math import sqrt


# function to calculate Cohen's d for independent samples
def cohen_d(d1, d2):
    # calculate the size of samples
    n1, n2 = len(d1), len(d2)
    # calculate the variance of the samples
    s1, s2 = var(d1, ddof=1), var(d2, ddof=1)
    # calculate the pooled standard deviation
    s = sqrt(((n1 - 1) * s1 + (n2 - 1) * s2) / (n1 + n2 - 2))
    # calculate the means of the samples
    u1, u2 = mean(d1), mean(d2)
    # calculate the effect size
    return (u1 - u2) / s

effect_sizes = []
cols = [
    "revenue",
    "fb_likes",
    "quantity_sold",
    "prom_length",
    "price",
    "discount_pct",
    "coupon_duration",
    "featured",
    "limited_supply",
]

for cl in cols:
    p_before = t_test(df_control, df_treatment, DV = cl)
    p_after = t_test(df_matched_control, df_matched_treatment, DV = cl)
    cohen_d_before = cohen_d(df_treatment[cl], df_control[cl])
    cohen_d_after = cohen_d(df_matched_treatment[cl], df_matched_control[cl])
    effect_sizes.append([cl, "before", cohen_d_before, p_before])
    effect_sizes.append([cl, "after", cohen_d_after, p_after])


df_effect_sizes = pd.DataFrame(
    effect_sizes, columns=["feature", "matching", "effect_size", "p-value"]
)

fig, ax = plt.subplots(figsize=(15, 5))
bar_plot = sns.barplot(
    data=df_effect_sizes, x="effect_size", y="feature", hue="matching", orient="h"
)

fig = bar_plot.get_figure()
fig.savefig("horizontal_bar.png")

傾向評分匹配是一種包含多個步驟的共變數分析,它的目的是在於平衡多個共變數對在二元自變項的影響,進而得到更接近且反映自然現象的結果。然而,在此例中我們也看到了,使用PSM可能會有許多處理組樣本找不到適當的對照組匹配,因此若這些樣本確有價值,而我們沒有使用到,導致部份資料流失。無論如何,在此例中,使用或是不使用PSM都沒有改變三項依變須的統計檢驗結果。歸根結底,是否該使用PSM仍須依靠研究者根據個別情況做分項考量。。
參考資料
- groupon.csv 來自於 Gang Wang's kaggle page.