GTSRB
GTSRB*1 資料集收集43種德國的交通號誌。資料集將圖檔分類為43個資料夾,資料夾以五個數字命名,自00000到00042。每一個資料夾儲存一種交通號誌*2。每個資料夾包含了多個不同明亮,模糊程度的圖檔(Data augumenation)*3。
此文展示兩項概念:
- data augumentation 的優點
- ensemble的概念及實作。
我們將使用三個深層CNN模型VggNet16, ResNet and VggNet5來進行交通號誌的分類作業。簡言之 ensemble 模型指的是使用多個模型共同決定分類的推測,而多數決是最常用的 ensemble 的實現方式之一。
# 資料夾的命名
#  [1] "00000" "00001" "00002" "00003" "00004" "00005" "00006" "00007" "00008"
# [10] "00009" "00010" "00011" "00012" "00013" "00014" "00015" "00016" "00017"
# [19] "00018" "00019" "00020" "00021" "00022" "00023" "00024" "00025" "00026"
# [28] "00027" "00028" "00029" "00030" "00031" "00032" "00033" "00034" "00035"
# [37] "00036" "00037" "00038" "00039" "00040" "00041" "00042"

# 各個號誌類別(0,... 42)所包含的樣本數
#   0    1    2    3    4    5    6    7    8    9   10   11   12   13   14   15
#  150 1500 1500  960 1320 1260  300  960  960  990 1350  900 1410 1440  540  420
#   16   17   18   19   20   21   22   23   24   25   26   27   28   29   30   31
#  300  750  810  150  240  240  270  360  180 1020  420  180  360  180  300  540
#   32   33   34   35   36   37   38   39   40   41   42
#  180  480  300  810  270  150 1380  210  240  180  180
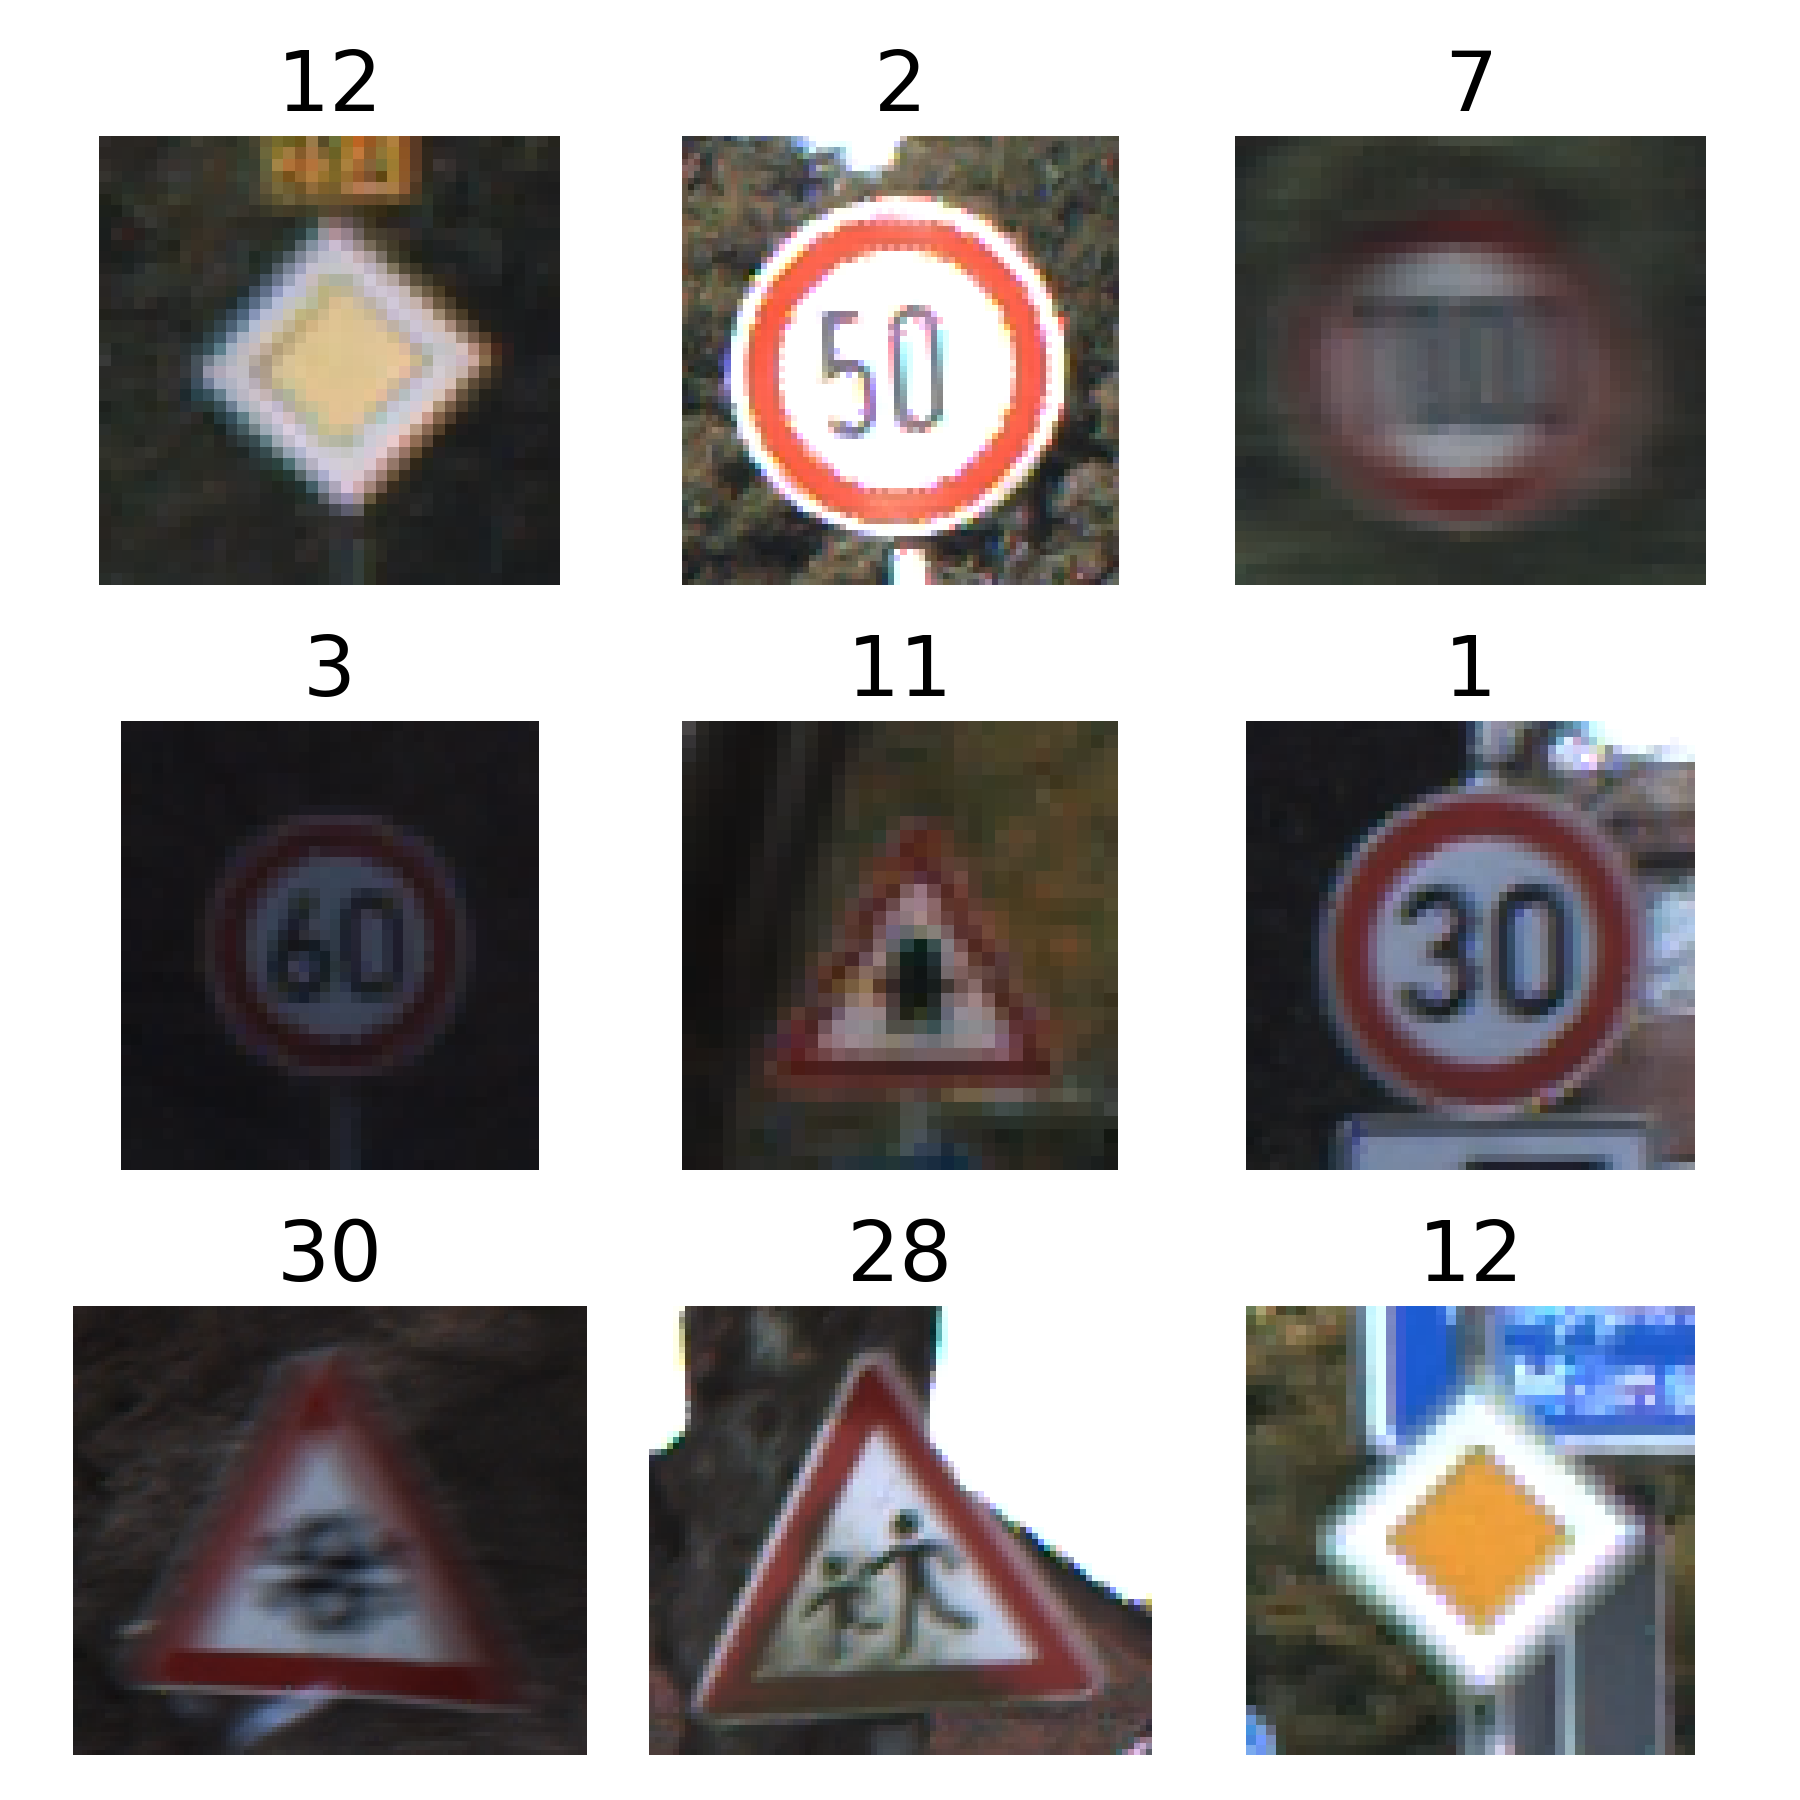
上列程式碼列出圖檔資料夾的命名方式,以及各個號誌類別(0,... 42)所包含的樣本數,下圖展示9張隨機取出的號誌圖案。有些圖案非常的模糊,例如第一行第三欄,它看來似乎是限速70的號誌。此張圖案也許是車輛高速行駛時,攝影機所拍下的影像,準確地辨識這些號誌對於車用號誌辦識系統將有很大助益。

- 我們先將整理資料,方便Tensorflow處理。
- 接下來我們將前文 ー 卷積類神經網絡辨識MNIST影像 ー 的模型建構碼,置換為ResNet,VggNet或VggNet5。
- 接著檢驗驗證組的訓練結果。
# 預處理資料
python3 preprocess.py "../data/GTSRB/GTSRB-Training_fixed" "tmp_data/GTSRB.pkl" --random_seed 42

# 訓練模型
python3 fit_resnet.py 'tmp_data/GTSRB.pkl' "models/resnet_history.pkl" "models/resnet.weights.h5" "models/resnet.keras" --nepoch 30

python3 fit_vgg5.py 'tmp_data/GTSRB.pkl' "models/vgg5_history.pkl" "models/vgg5.weights.h5" "models/vgg5.keras" --nepoch 30

python3 fit_vgg16.py 'tmp_data/GTSRB.pkl' "models/vgg16_history.pkl" "models/vgg16.weights.h5" "models/vgg16.keras" --nepoch 30
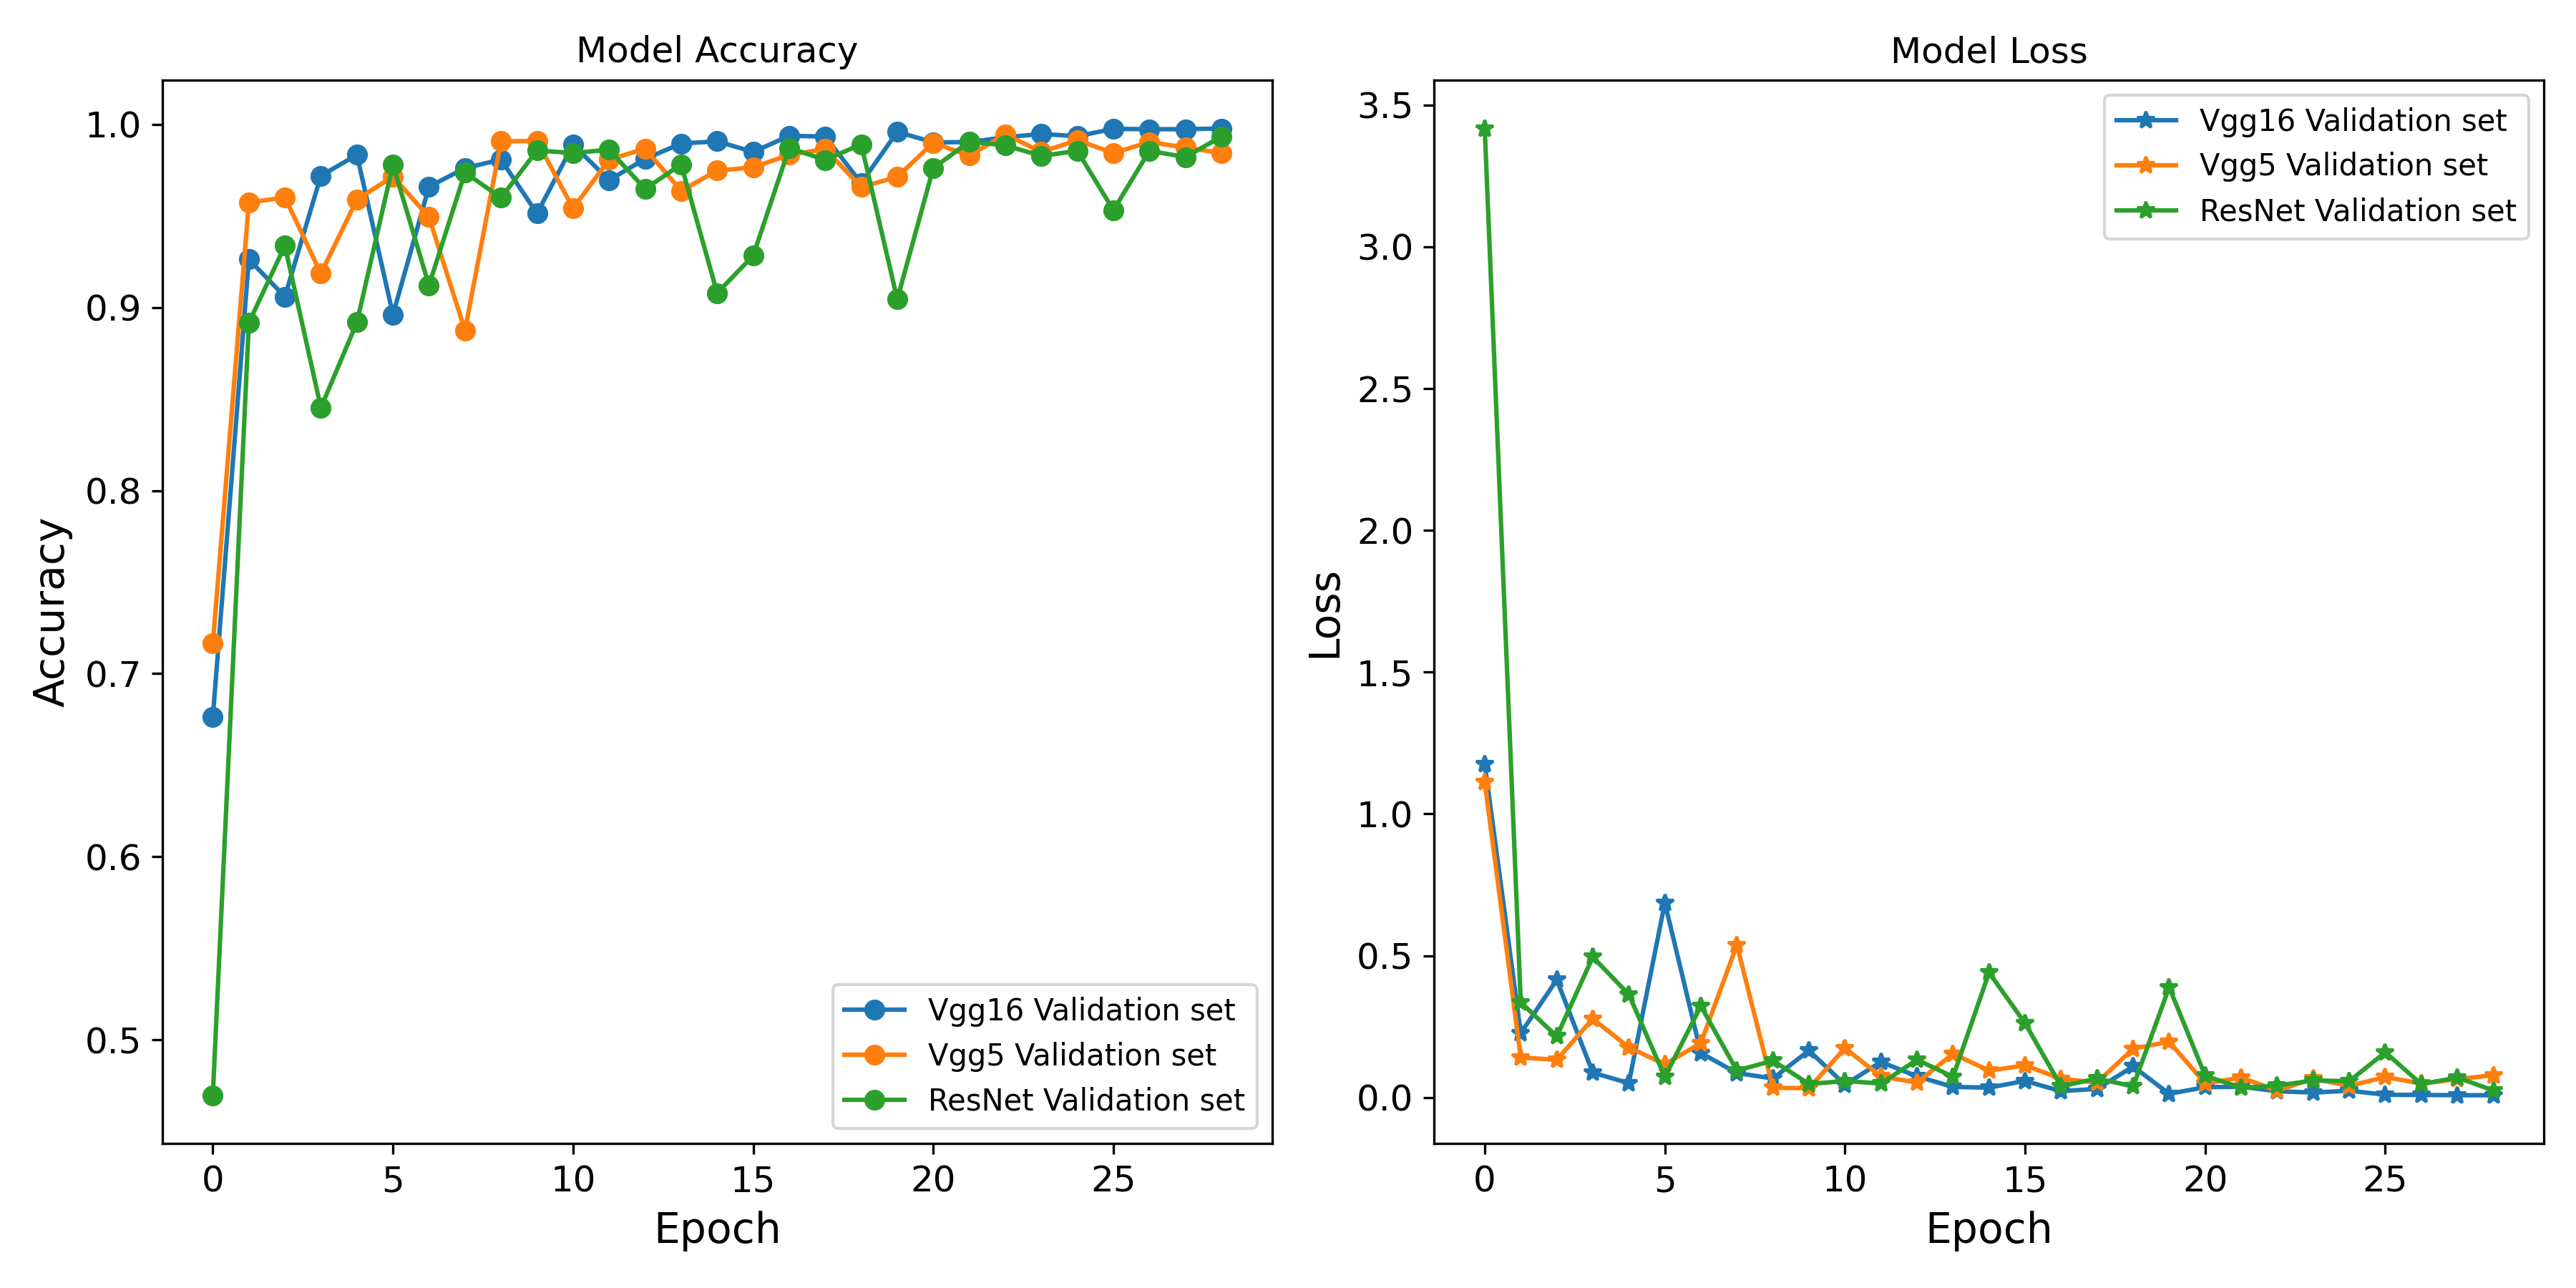
三個模型在經過30個遞迴後,在測試組的評估都達到相當高的正確率。
| Model | accuracy | loss | errors |
|---|---|---|---|
| VggNet16 | 0.9976 | 0.0120 | 16 |
| VggNet5 | 0.9941 | 0.0264 | 39 |
| ResNet | 0.9899 | 0.0438 | 67 |
| Ensemble | 0.9980 | NA | 13 |
在6660筆的號誌圖檔中,三個模型的誤判數分別為16, 39, 67。
- 接下來我們計算三個模型對測試組的推測,並以多數決來決定最終的預測類別。
vgg16_prob  = vgg16_model.predict(X_test)
vgg5_prob   = vgg5_model.predict(X_test)
resnet_prob = resnet_model.predict(X_test)
vgg16_pred  = np.array([np.argmax(i) for i in vgg16_prob])
vgg5_pred   = np.array([np.argmax(i) for i in vgg5_prob])
resnet_pred = np.array([np.argmax(i) for i in resnet_prob])

# Vertical stack predictions
predictions = np.vstack((vgg16_pred, vgg5_pred, resnet_pred))

# Find the column-wise mode
majority_vote = mode(predictions, axis=0)
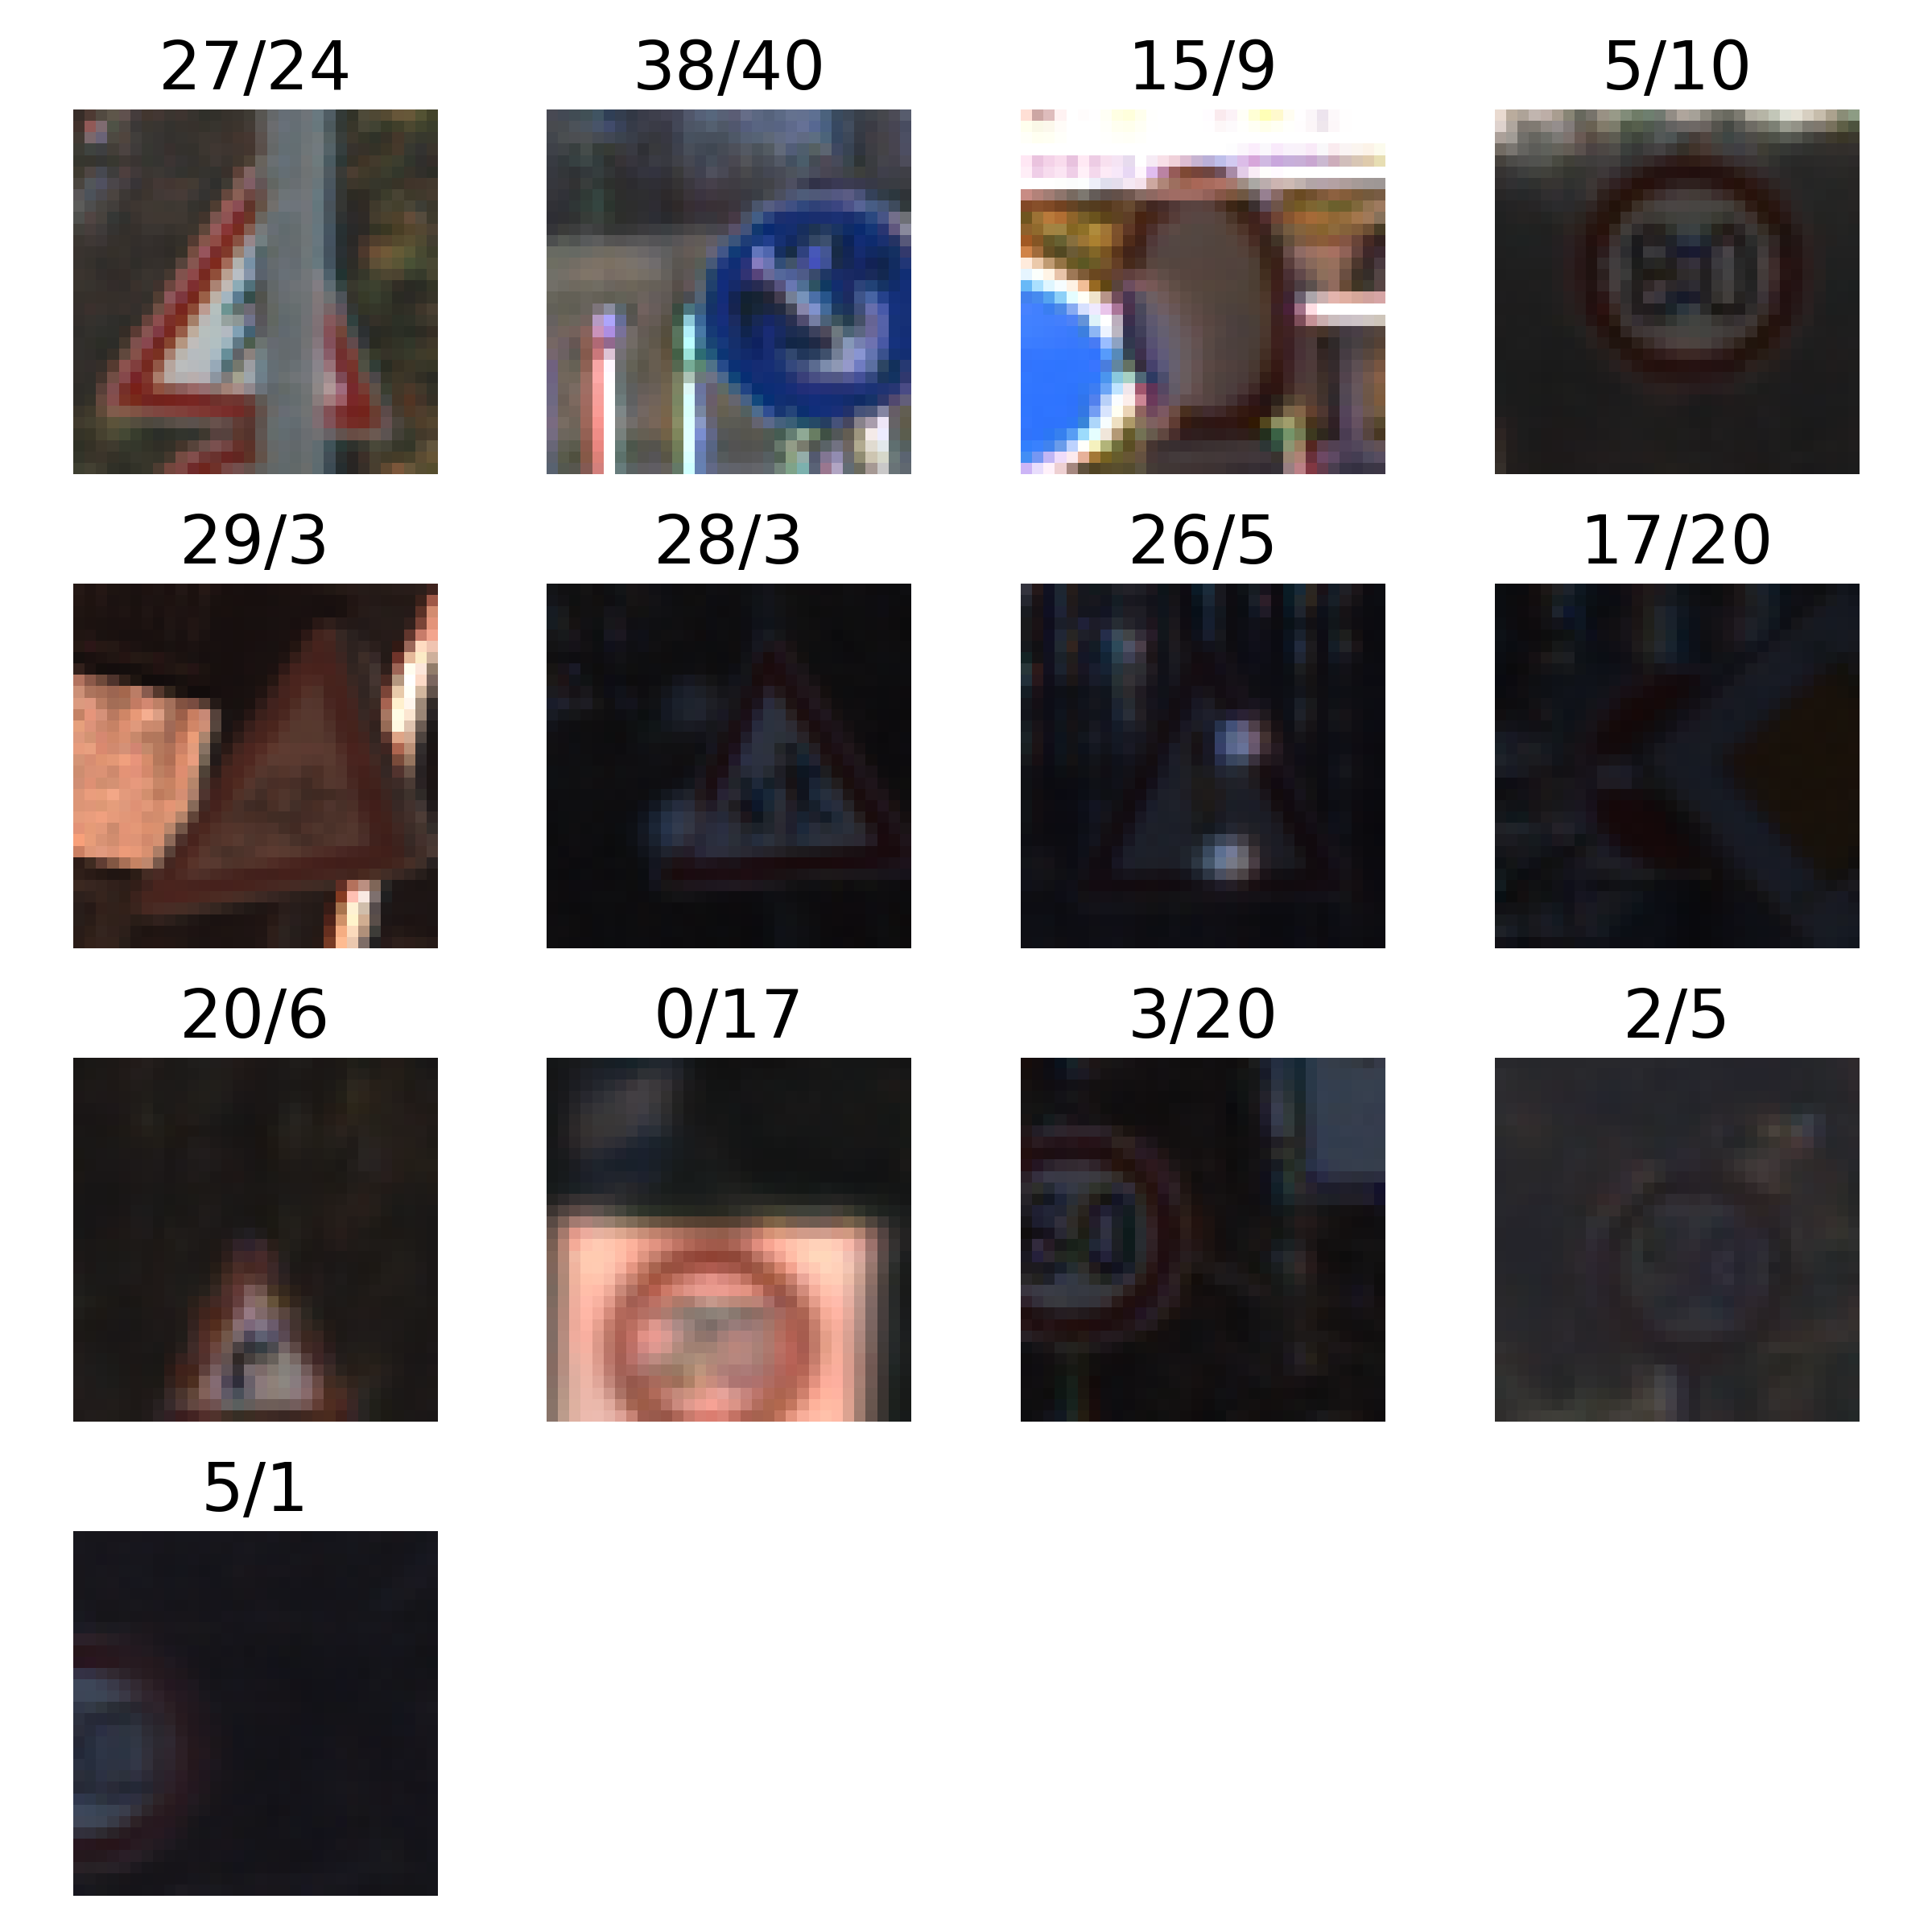
多數決模型僅誤判了13張圖檔,達到了99.8%的正確率。下圖印出此13張誤判的圖檔,圖上的標籤顯示,正確類別/預測類別。

小結
此文我們展示了資料增強及 ensemble 模型的實作方式,並測試了一項現實生活中的實際應用例子,此兩項機器學習概念可以分別在知覺心理以及認知心理學裡的理論找到其概念根源,但在機器學習上的實現方式,有不少細節的不同須特別注意。
註腳
- GTSRB (German Traffic Sign Recognition Benchmark)
- 資料的來源網站有多個不同zip檔案,這兒此指的是
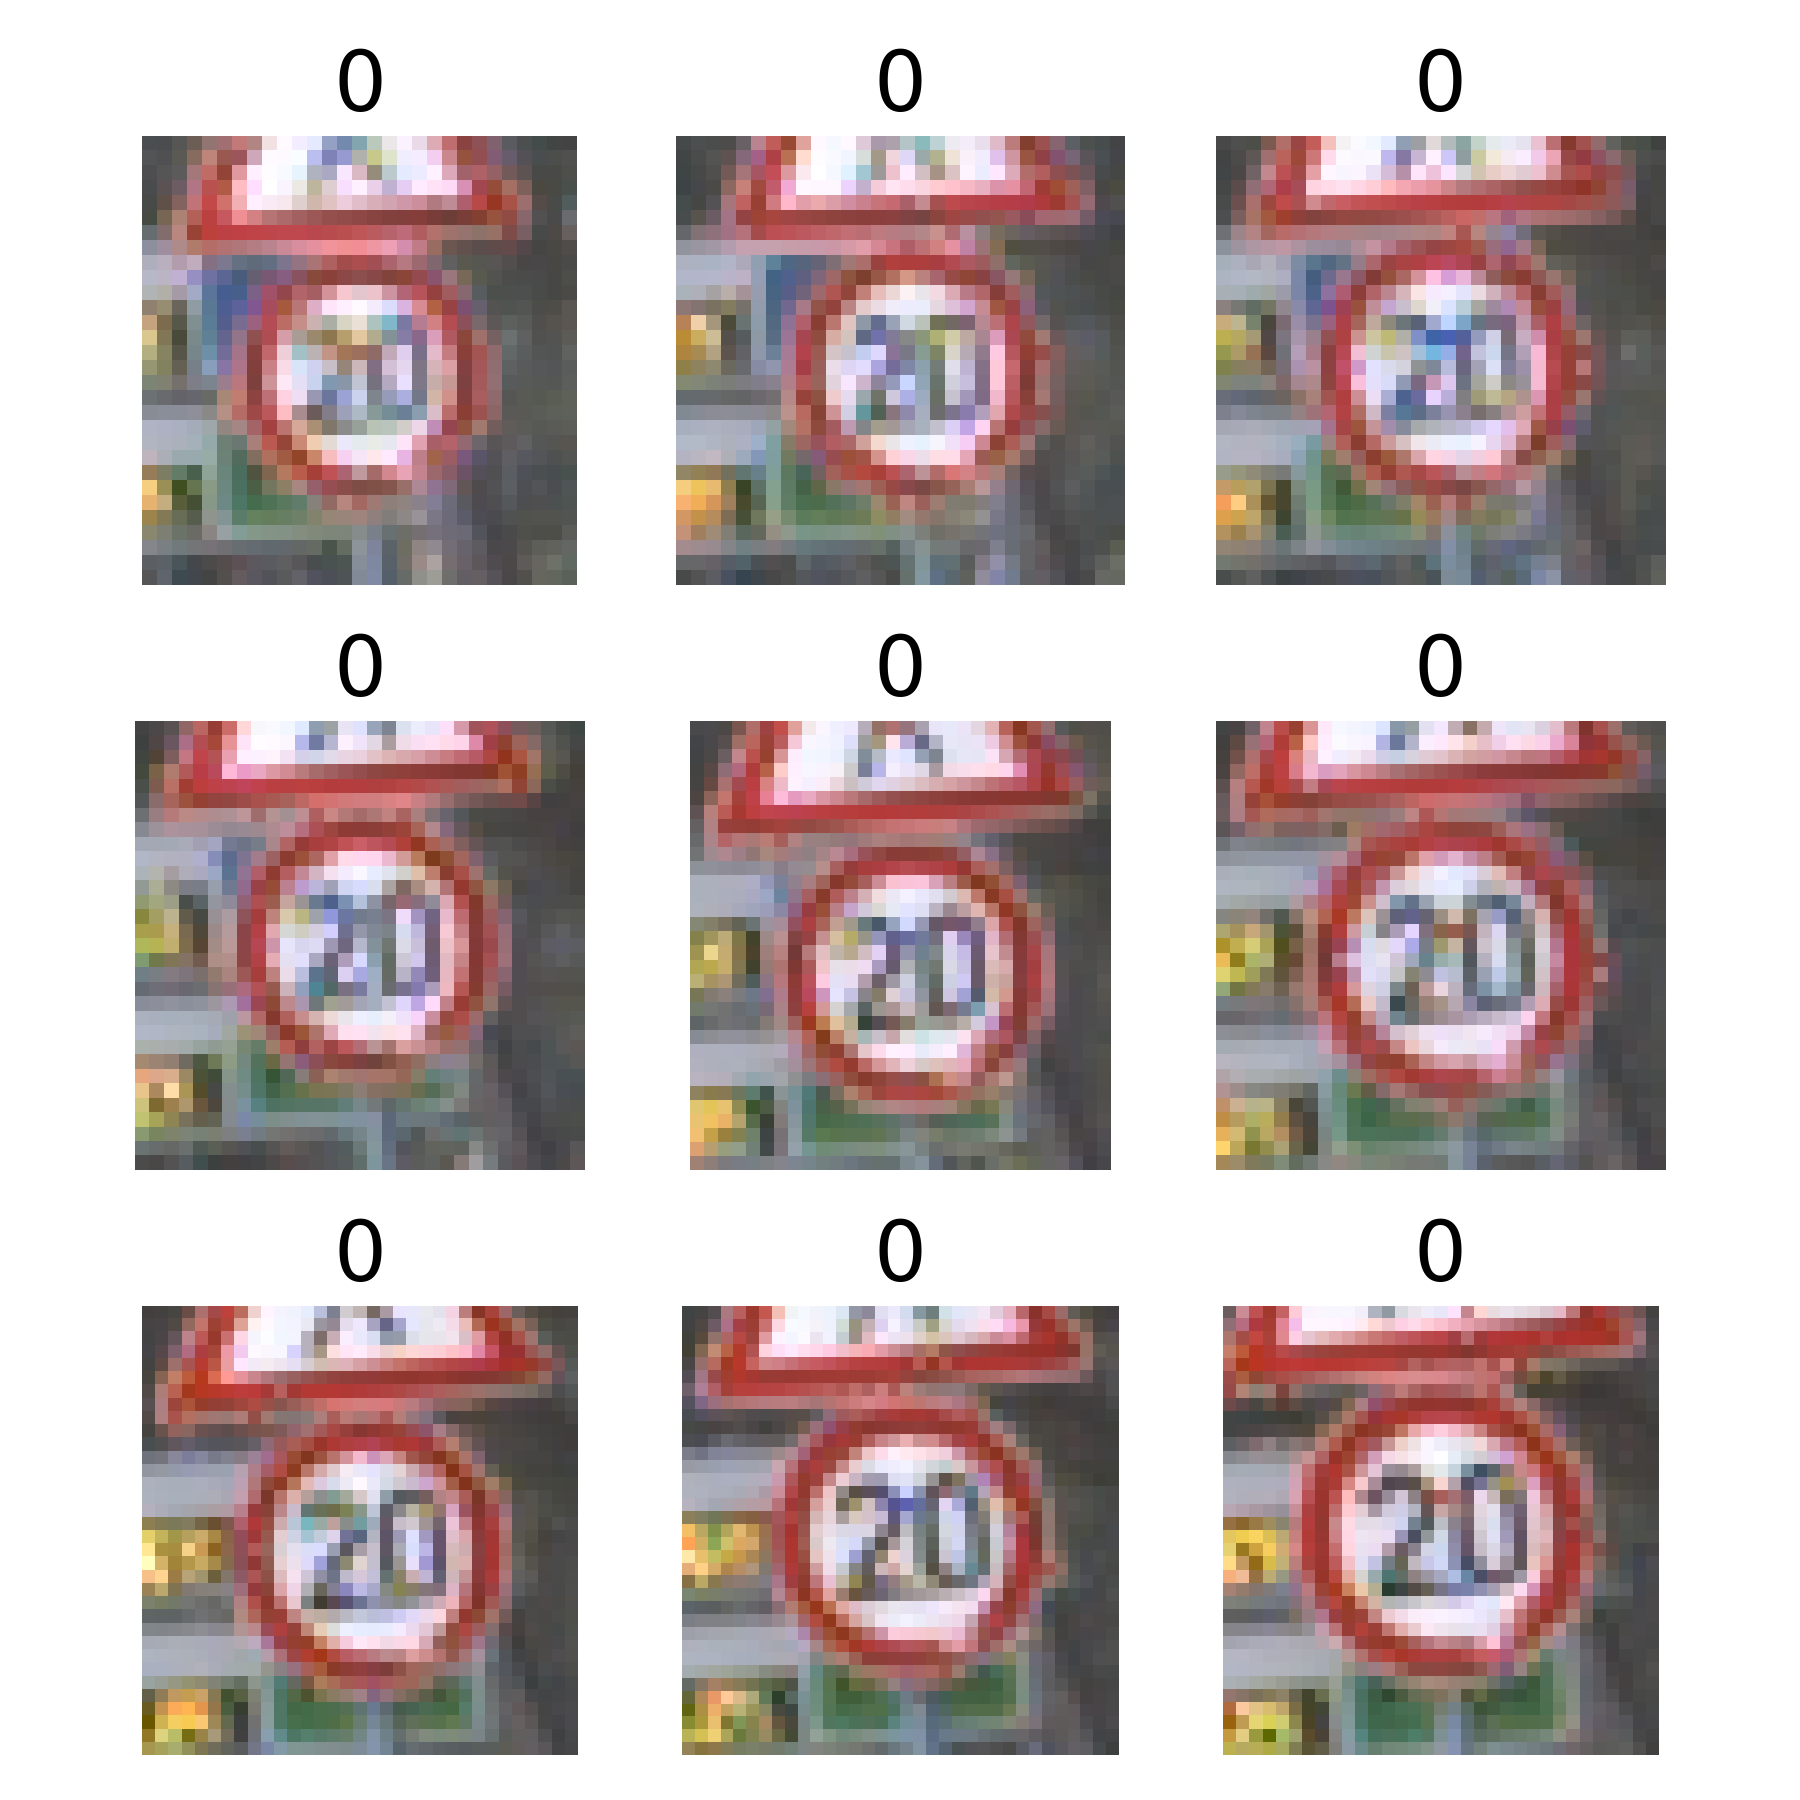
GTSRB-Training_fixed.zip檔案。 - 資料增強(Data augumentation)借用一個統計學的術語,但是在機器學習文獻中,資料增強指稱些微不同的概念。在知覺心理學討論視覺概念時,雖然同一個外界物體的影像,在不同的觀察條件下,其物理影像呈現不同,但觀察者心理上會將這些不同的物理影像感知、解釋為同一個物體,如果它確實是同一個物體。在機器學習中,資料增強指的是,我們使用軟體,例如Photoshop或是任何程式語言的影像操弄方法改變同一個影像檔的明暗、模糊程度或是改變環境的光照方式,使同張照片, 同一物體,外觀改變,例如,色彩,明暗或是擺放角度等等,但實際照片的內容不變。如此在進行訓練時,資料樣本總數會明顯地增加,如下圖不同裁切方式的限速20號誌。

附錄
1. 繪製交通號誌的程式碼
import numpy as np
import matplotlib.pyplot as plt
from PIL import Image
import csv
import random


images = [] # images
labels = [] # corresponding labels
data_path = '../data/GTSRB/GTSRB-Training_fixed'
ppm_files = []

# 0, 1, ... 42  // loop over all 42 classes
for c in range(0, 43):

    # subdirectory for class
    prefix = data_path + '/' + format(c, '05d') + '/'
    # annotations file
    gtFile = open(prefix + 'GT-'+ format(c, '05d') + '.csv')

    # csv parser for annotations file
    gtReader = csv.reader(gtFile, delimiter=';')
    next(gtReader) # skip header

    # loop over all images in current annotations file
    for row in gtReader:
        # the 1th column is the filename
        ppm_files.append(prefix + row[0])
        images.append(plt.imread(prefix + row[0]))
        labels.append(row[7]) # the 8th column is the label
    gtFile.close()


PROJECT_ROOT_DIR = "."
IMAGES_PATH = os.path.join(PROJECT_ROOT_DIR, "images")
os.makedirs(IMAGES_PATH, exist_ok=True)

def save_fig(fig_id, tight_layout=True, fig_extension="png", resolution=300):
    path = os.path.join(IMAGES_PATH, fig_id + "." + fig_extension)
    print("Saving figure", fig_id)
    if tight_layout:
        plt.tight_layout()
    plt.savefig(path, format=fig_extension, dpi=resolution)

nsample = len(images)
# Generate 50 unique random numbers from 0 to 26639
random_index = random.sample(range(nsample), 50)

n_rows = 3
n_cols = 3
plt.figure(figsize=(n_cols * 2, n_rows * 2))
for row in range(n_rows):
    for col in range(n_cols):
        index  = n_cols * row + col
        rindex = random_index[n_cols * row + col]
        image = images[rindex]
        label = labels[rindex]
        plt.subplot(n_rows, n_cols, index + 1)
        plt.imshow(image, cmap="binary", interpolation="nearest")
        plt.axis('off')
        plt.title(label, fontsize=20)

plt.subplots_adjust(wspace=0.2, hspace=0.5)
plt.tight_layout()
save_fig('traffic_signs')
2. 預處理資料的程式碼
import numpy as np
import matplotlib.pyplot as plt
from PIL import Image
import csv
from sklearn.model_selection import train_test_split
from sklearn.utils import shuffle
import pickle as pkl
import argparse


# Desired image size
IMG_HEIGHT = 32
IMG_WIDTH = 32


# Function to load and preprocess images
def load_and_preprocess_image(path):
    image = Image.open(path)
    image = image.resize((IMG_HEIGHT, IMG_WIDTH))
    image = np.array(image) / 255
    return image


if __name__ == "__main__":
    # python3 preprocess.py "../data/GTSRB/GTSRB-Training_fixed" "tmp_data/GTSRB.pkl" --random_seed 42

    parser = argparse.ArgumentParser(description="Process GTSRB data")

    parser.add_argument("data_path", type=str, help="Path to the raw data")
    parser.add_argument("output_path", type=str, help="Path to the output")
    parser.add_argument("--random_seed", type=int, default=42)

    args = parser.parse_args()
    DATA_PATH = args.data_path
    OUTPUT_DIR = "tmp_data/GTSRB.pkl"
    random_seed = args.random_seed


    labels, ppm_files = [], []
    for c in range(0, 43):

        prefix = DATA_PATH + "/" + format(c, "05d") + "/"
        gtFile = open(prefix + "GT-" + format(c, "05d") + ".csv")

        gtReader = csv.reader(gtFile, delimiter=";")
        next(gtReader)  # skip header

        for row in gtReader:
            # the 1th column is the filename
            ppm_files.append(prefix + row[0])
            labels.append(row[7])  # the 8th column is the label
        gtFile.close()

    images = np.array([load_and_preprocess_image(f) for f in ppm_files])
    labels = np.array([int(label) for label in labels])
    nclass = len(np.unique(labels))

    X_train_full, X_test, y_train_full, y_test = train_test_split(
        images, labels, random_state=random_seed)

    X_train_full, y_train_full = shuffle(X_train_full, y_train_full,random_state=random_seed)

    X_train, X_valid, y_train, y_valid = train_test_split(
        X_train_full, y_train_full, random_state=random_seed)

    data = {
        "X_train": X_train,
        "X_valid": X_valid,
        "X_test": X_test,
        "y_train": y_train,
        "y_valid": y_valid,
        "y_test": y_test,
    }


    with open(OUTPUT_DIR, "wb") as file_obj:
        pkl.dump(data, file_obj)
3. ResNet訓練碼
VggNet和VggNet5與此程式碼類似,僅須置換建模部份即可
import pickle as pkl
import os
import numpy as np

import argparse
from tensorflow import keras

from utils.resnet import resnet as resnet50

import tensorflow as tf
from tensorflow.keras.layers import Input
from tensorflow.keras.models import Model
from tensorflow.keras.optimizers import Nadam


if __name__ == "__main__":
    # python3 fit_resnet.py 'tmp_data/GTSRB.pkl' "models/resnet_history.pkl" "models/resnet.weights.h5" "models/resnet.keras" --nepoch 30

    parser = argparse.ArgumentParser(description="Process GTSRB data")

    parser.add_argument("data_path", type=str, help="Path to the data file")
    parser.add_argument("output_path", type=str, help="Path to the history file")
    parser.add_argument("weight_output", type=str, help="Path to the model weights")
    parser.add_argument("model_output", type=str, help="Path to the model")
    parser.add_argument("--nepoch", type=int, default=30, help="Number of epoch")

    args = parser.parse_args()
    DATA_PATH = args.data_path
    HISTORY_PATH = args.output_path

    WEIGHT_PATH = args.weight_output
    MODEL_PATH = args.model_output

    nepoch = args.nepoch

    print(f"Data path provided: {DATA_PATH}")
    print(f"Data were stored: {HISTORY_PATH}")
    print(f"Weight was stored: {WEIGHT_PATH}")
    print(f"Model was stored: {MODEL_PATH}")
    print(f"The number of epoch: {nepoch}")

    with open(DATA_PATH, 'rb') as f:
        data = pkl.load(f)

    X_train = data['X_train']
    X_valid = data['X_valid']
    X_test = data['X_test']
    y_train = data['y_train']
    y_valid = data['y_valid']
    y_test = data['y_test']

    nclass = len(np.unique(y_train))
    input_shape = X_train[0].shape

    X = Input(shape=input_shape)
    y = resnet50(X, nclass)
    model = Model(X, y, name="resnet")


    model.compile(
        loss="sparse_categorical_crossentropy",
        optimizer=Nadam(learning_rate=0.001),
        metrics=["accuracy"])

    cp_callback = tf.keras.callbacks.ModelCheckpoint(
        filepath=WEIGHT_PATH, save_weights_only=True, verbose=1)


    history = model.fit(
        X_train, y_train,
        epochs=nepoch,
        batch_size = 32,
        validation_data=(X_valid, y_valid),
        callbacks=[cp_callback])


    print("Evaluating the test set:\n")
    model.evaluate(X_test, y_test)

    with open(HISTORY_PATH, "wb") as file_obj:
        pkl.dump(history, file_obj)

    model.save(MODEL_PATH)
4. 誤判圖之繪圖碼
import numpy as np
from scipy.stats import mode


# Stack predictions
predictions = np.vstack((vgg16_pred, vgg5_pred, resnet_pred))

# Find the majority vote for each sample (column)
majority_vote = mode(predictions, axis=0)[0]

vgg16_incorrect_indices = np.where(vgg16_pred != y_test)[0]
vgg5_incorrect_indices = np.where(vgg5_pred != y_test)[0]
resnet_incorrect_indices = np.where(resnet_pred != y_test)[0]
majority_vote_incorrect_indices = np.where(majority_vote != y_test)[0]

nincorrect = len(majority_vote_incorrect_indices)

n_rows = 4
n_cols = 4
plt.figure(figsize=(n_cols * 2, n_rows * 2))
for row in range(n_rows):
    for col in range(n_cols):
        index = n_cols * row + col
        if index > (nincorrect - 1):
            next
        else:
            incorrect_index = majority_vote_incorrect_indices[index]
            image = X_test[incorrect_index]
            label_data = y_test[incorrect_index]
            label_pred = majority_vote[incorrect_index]
            combined_label = f"{label_data}/{label_pred}"


            plt.subplot(n_rows, n_cols, index + 1)
            plt.imshow(image, cmap="binary", interpolation="nearest")
            plt.axis('off')
            plt.title(combined_label, fontsize=20)

plt.subplots_adjust(wspace=0.2, hspace=0.5)
plt.tight_layout()
save_fig('ensemble_error')
plt.show()